State diagram for outcomes
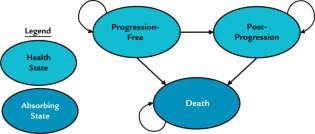
28 days cycles
Sample Size
Horizon of 3 years was chosen for the simulation (stable economic condition). Patients were censored after 36 months.
100 patients for each of the 3 arms
Total of 500 simulations were done

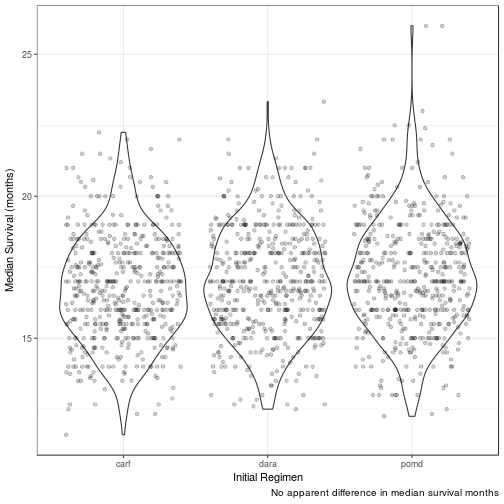
Few examples (POM-d arm)
Median Overall Survival (months)
| init_reg | mean_median_surv | 95LCL | 95UCL | 25centile | 75centile |
|---|---|---|---|---|---|
| pomd | 17.1570 | 13.3333 | 21.3575 | 15.8512 | 18.4071 |
| dara | 17.0114 | 13.5000 | 21.0000 | 15.6667 | 18.3333 |
| carf | 16.7497 | 13.5000 | 20.6667 | 15.5000 | 18.0000 |
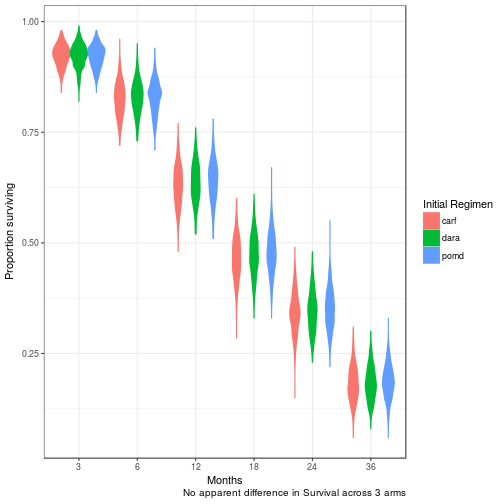
Overall Survival at 3, 6, 12, 18, 24, 36 months
Median Progression Free Survival (months)
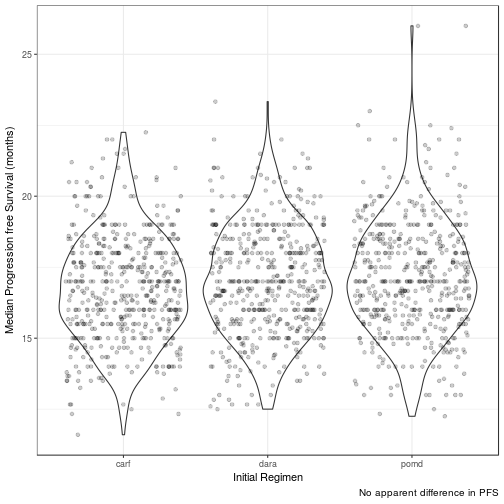
| init_reg | mean_median_pfs | 95LCL | 95UCL | 25centile | 75centile |
|---|---|---|---|---|---|
| pomd | 17.1425 | 13.3333 | 21.3575 | 15.8000 | 18.4000 |
| dara | 17.0007 | 13.5000 | 20.8812 | 15.6667 | 18.2708 |
| carf | 16.7488 | 13.5000 | 20.6667 | 15.5000 | 18.0000 |
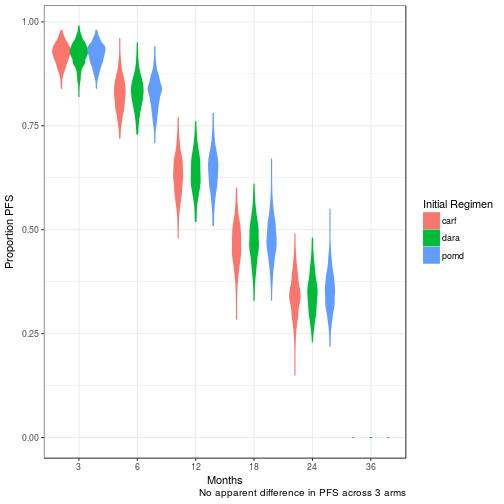
PFS at 3, 6, 12, 18, 24, 36months
Progression Free Life Months (PFLM)
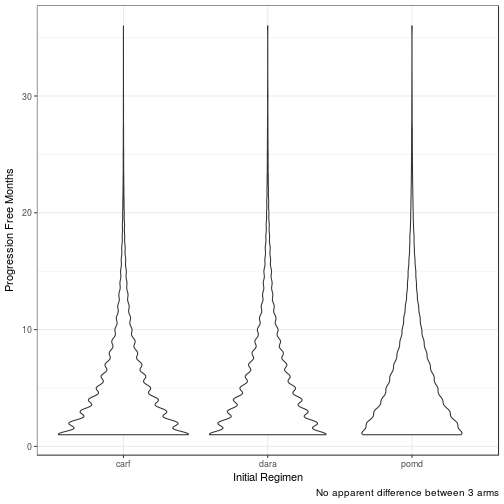
| init_reg | med_pfm | 95LCL | 95UCL | 25tile | 75tile |
|---|---|---|---|---|---|
| carf | 4 | 3 | 4 | 3 | 4.0 |
| dara | 4 | 3 | 5 | 4 | 4.0 |
| pomd | 4 | 3 | 5 | 4 | 4.5 |
Quality Adjusted Life Months (QALM)
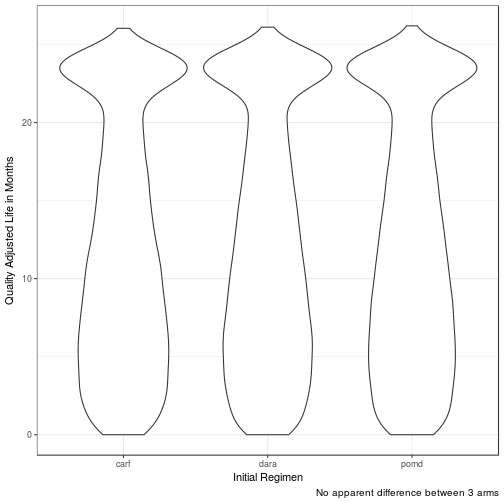
| init_reg | med_qalm | 95LCL | 95UCL | 25tile | 75tile |
|---|---|---|---|---|---|
| carf | 11.0293 | 8.8127 | 13.7548 | 10.2393 | 11.9131 |
| dara | 11.2297 | 9.0112 | 13.7750 | 10.3453 | 12.1640 |
| pomd | 11.3767 | 8.9134 | 14.0928 | 10.5132 | 12.2253 |
Regimen associated Discounted Cost
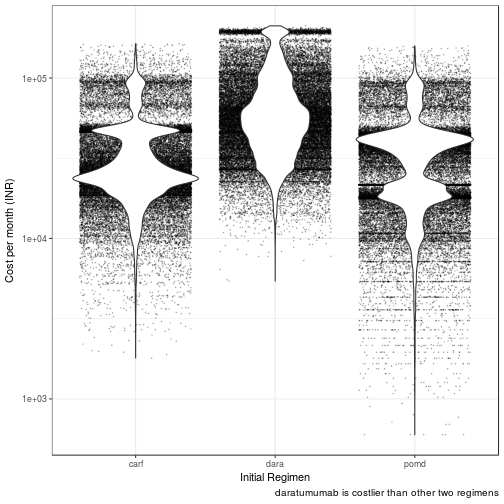
| init_reg | med_cost_month | 95LCL | 95UCL | 25tile | 75tile |
|---|---|---|---|---|---|
| dara | 55143.72 | 48638.94 | 63355.32 | 52726.57 | 57723.10 |
| pomd | 32370.84 | 21656.73 | 37982.45 | 29379.04 | 34890.15 |
| carf | 25769.79 | 23650.16 | 29015.03 | 24905.19 | 26911.36 |
Cost per QALM
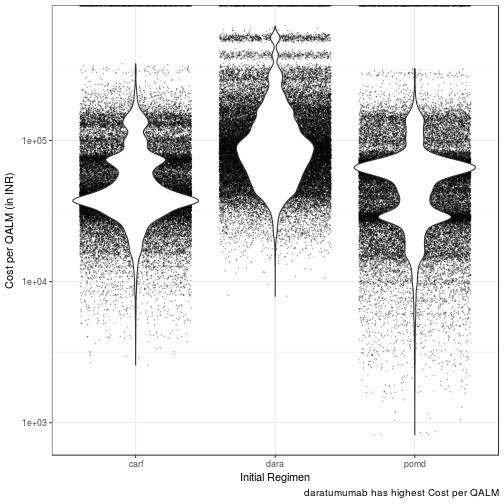
| init_reg | med_cost_qalm | 95LCL | 95UCL | 25tile | 75tile |
|---|---|---|---|---|---|
| dara | 86609.35 | 76026.52 | 99518.78 | 82721.20 | 90635.68 |
| pomd | 55897.85 | 44735.16 | 61518.81 | 51986.42 | 58222.93 |
| carf | 41495.18 | 37974.16 | 47988.91 | 40129.71 | 43575.42 |